A condominium in Mammoth costs less today than it did in 2006.
Not in dollars — in dollars it costs far more. But once you adjust for what those dollars buy, the median condominium sale is still below where it stood at the 2006 peak, twenty years later. In between the market lost more than 60% of its real value, and the town never went back to building at anything like its old pace.

Mammoth home prices, 1971–2026
log scale · 2026 dollars · pale segments carried by the FHFA repeat-sales index for 93546 · shaded years are documented declines

What $43,900 bought in 1997
No public dataset covers Mammoth property before 1998. The back page of the Mammoth Times covers it every Thursday from 1997 — a studio at Conestogas, a corner lot walking distance from Canyon Lodge, a three-bedroom on Snowcreek IV. There are too few of these to average and they are asking prices rather than sales, so they are not a chart. They are the advertisements themselves, with what each price would be today.
2-BD/2-BA VERY NICE in/out, 1400 sq. ft., pets OK, low space rent, yard, lg. shed, must sell, $26,900. Call 935-4544
$26,900$55,392 in 2026 moneyCOZY SPLIT-LEVEL studio/loft townhome style floor plan w/extra bath at Conestogas. Easy walk to spa in sm., quiet complex near Canyon Lodge. Low common area fees Asking only $43,900 furn. Call Mammoth Properties, 934-688
$43,900$90,398 in 2026 moneySPACIOUS 2-BD/LOFT/3-BA, fully furn., full-amenity project, shuttle-bus location, $75,900. Call Mammoth Properties at 934-6881 or 800-462-5575
$75,900$156,291 in 2026 moneyTRUE WALKING DISTANCE TO CANYON LODGE, this corner lot offers a lovely wooded setting for both winter & summer enjoyment. $77,500. Call Mammoth Properties at 934-6881 or 800-462-5575
$77,500$159,586 in 2026 moneyCHAIR #15 LOCATION - Cute 2-BD/1-BA condo, country decor, across from golf, 2 chair lifts, & Juniper Ridge Steps to tennis, pool, spas, $82,900. Call JANICE GRAY, agent, Century 21 Mammoth Realty, 800-462-5586 or 934-770
$82,900$170,706 in 2026 moneyA "STONES THROW" from Canyon Lodge, you can't get closer. 2-BD/2-BA + private gar., townhome, white washed, newly furn., spacious, turn-key, $85,000. Call JANICE GRAY, agent, Century 21 Mammoth Realty, 800-462-5586 or 93
$85,000$175,030 in 2026 moneyLG. HOME ON TWO LOTS. 3-BD/den/office/3-BA, lots of living space + lg. workshop, nice spa, $225,000. Call Mammoth Properties, 934-6881 or 800-462-5575
$225,000$463,315 in 2026 moneyROOM FOR THE WHOLE FAMILY! 3-BD + loft corner townhome at Snowcreek IV, 2100 sq. ft. of spacious living, decorator furn., views galore, REDUCED to $249,000. Call JANICE GRAY, agent, Century 21 Mammoth Realty, 800-462-558
$249,000$512,735 in 2026 money
Every property advertisement we can still read from the Mammoth Times classifieds, 1997–2003. The button opens the rest; what is behind it is the remainder in date order, not the ones we thought were less interesting. These are asking prices: what a seller wanted, which through the late 1990s was a different number from what anyone paid. Out-of-town listings and syndicated national filler are excluded.

The other half of the housing market
Fifty-eight percent of the housing stock in this town is somebody’s second home, which means every price on this page is a story about owners. Rent is the story about everyone else — the people who work here — and it is the number the workforce-housing argument actually turns on. A studio asked $335 a month in 1997, about $690 in today’s money. The median rent in 2024 was $1,645.
What it costs to rent
American Community Survey 5-year estimates, table B25064 · 2026 dollars
Median gross rent is contract rent plus utilities, as tenants report it. These are five-year rolling estimates for a town of seven thousand people, so consecutive years overlap and the margin of error reaches ±$200 — which is why the band is drawn, and why a single year’s move inside it means nothing on its own.
The town stopped approving new housing, and never went back
Across 2000–2008 the town approved 1,560 residential units, about 173 a year. Across the seventeen years since, it approved 524 — about 31 a year. Building did resume: 118 units in 2022 and 100 in 2024, largely the Parcel and other deed-restricted housing. But whole years in between ran to fewer than half a dozen. Supply is the part of this market that never recovered, and it is why prices move the way they do when demand comes back.
Housing units authorised, 1991–2025
US Census Building Permits Survey · linear scale


Every shop and restaurant we can account for
A thousand businesses inside the town limits, assembled from liquor licences, chamber directories, the newspaper archive and forty years of broker reports. Every source covers the whole Eastern Sierra, so each business is placed by the address on its own licence or its Google geocode, and June Lake, Bridgeport and Lee Vining are held out. It is the closest thing that exists to a record of what has been open in this town, and it is unavoidably uneven: the further back you go, the more a business had to do to leave a trace.
Operating spans, longest first
A bar runs from the first time a business appears in any source to the last. That is a floor, not a lifespan: a place that never advertised and never made the paper leaves no trace between its two mentions.
Openings and closings each year
Counted only from sources that reported a change as news. Directory snapshots cannot date an opening — the first time a directory is archived, every business already in it looks new — so they are excluded here and the record starts in 2009, where coverage steadies.
tap a year
How long a business lasts, once it opens
Kaplan-Meier · 210 businesses with a dated licence or filing · 112 closures
A business still trading is censored, not counted as a short life — otherwise everything that opened recently would look doomed by arithmetic alone. The clock starts at a licence or a County Clerk filing, never at a directory listing: the first time a directory is archived every business already in it registers as new. 149 records where a licence was issued and surrendered the same day are excluded as transfers rather than businesses that opened and shut in an afternoon. The figures read high against the national picture partly because they are true and partly by construction — nothing here can see a business that failed before it ever filed for anything.

What visitors spend
Mammoth taxes the people who sleep here, which means the Town has been keeping an unbroken account of its own visitor economy since 1987 — longer than it has kept one of its housing market.
Transient occupancy tax collected
What visitors pay to sleep here, and the closest thing the Town has to a continuous measure of its own economy. Only complete twelve-month years are shown — monthly receipts are violently seasonal and a February figure means nothing beside a September one.
Tourism district assessments, by sector
The business improvement district charges by sector, so its receipts split spending into lodging, restaurants, retail and the mountain — a decomposition nothing else we hold provides.

Why the price line turns when it does
The price of a Mammoth condominium has never moved on its own. It moves when the cost of borrowing moves, and the two biggest turns on this site — the market stopping dead in the early 1980s and going vertical in 2021 — sit either side of the highest and lowest mortgage rates ever recorded. The rate is a national figure, not a Mammoth one; what is local is how sharply a second-home market reacts to it.
The cost of money, against the cost of a condominium
30-year fixed rate · Freddie Mac Primary Mortgage Market Survey, via FRED · United States
How the market is behaving
Asked and paid, per square foot
Mono County · monthly · 2012-01 to 2026-05
Price says what a home costs. These say how the market is behaving — how fast it moves, how much is for sale, and who has the upper hand. Several are published for Mono County rather than the town; each says which.
How long a listing sits before it sells.
How long the standing inventory would last at the current pace. Under four is a seller's market.
What sellers actually get against what they asked. Above 100% means bidding above asking.
The share of active listings that dropped their price this month.
Active condominium listings. The record reaches back to 1979.
Condos coming onto the market each month.
Who is buying
What buyers say the property is for
Every mortgage application in the country is reported under the Home Mortgage Disclosure Act, and it records what the borrower intends: a home to live in, a second home, or an investment. For a resort town that is the whole question, and no listing site will answer it. Mono County, which is the finest grain HMDA publishes and is dominated by Mammoth.
Second homes were 59% of purchases in 2018 and peaked at 62.5% in 2020. By 2023 they were 28.1%, while investment purchases went from 5.7% to 36.7%. The buyer changed.
Income moving in and out of Mono County
From IRS county-to-county migration: what households arriving earn against what leaving households earn. The gap is the clearest measure we have of who the town is being exchanged for.
For comparison, the median income of someone taking a mortgage here reached $326k in 2025, against a median property value of $735k.
Who lives here
The Town studied its own population once, in 2008, ahead of a state-mandated Housing Element. It is the only source here for age, education and household income — and it landed on the same nine years the condo market used to roughly triple.
The affordability scissors
The Town's only demographic study, a background report for its 2009 Housing Element, surveyed the same two years — 1999 and 2008 — that the condo market went from a pre-boom lull to its first peak. Median household income is stated by the source in constant 2008 dollars; the price alongside it is nominal, the same figure the price chart above uses.
Household income -8% against a condo median up +170% over the same nine years. Whatever bought a Mammoth condo in 2008 was not the town's own paycheck.
Who the town was, 2000 to 2008
Residents by age bracket, Town of Mammoth Lakes.
The housing stock, 2008
9,245 units, by structure type — the large condo/apartment share is what a resort town's building stock looks like.
Source: Town of Mammoth Lakes, 2009 Draft Housing Needs Assessment (2008 estimates unless noted). A one-time study, not an ongoing series — figures here do not update between Housing Element cycles.

The ground the town is built on
Mammoth sits on the rim of a caldera that has never stopped moving. Over two days in May 1980 four magnitude-6 shocks hit; in 1982 the USGS issued a Notice of Potential Volcanic Hazard and lots stopped selling. The hazard designation outlived the hazard by decades — which is visible here, in how quiet the record has been ever since.
Earthquakes in the Long Valley Caldera, 1970–2026
USGS · 5,478 events of magnitude 2.5 or greater · square-root scale

Snow
Season snowfall at the Main Lodge
A snow year runs July to June and is labelled by the year it ends, so the 2023 season is the winter of 2022–23. Worth saying plainly: we tested this against prices and found nothing. Snowfall correlates at +0.14 with lodging tax and −0.27 with the following year’s prices — which is to say a big winter does not make the market. Paul Oster reached the same conclusion in January 2025 from the other direction.
tap a season

The town, parcel by parcel
Every parcel in Mammoth Lakes at its true position, on the real street grid. The colour is the thing that decides what a condominium here is worth and which no listing shows you: whether it may be rented by the night.

By complex, and by sale
Individual transactions recovered from broker reports — a sample of what got written about, not a complete register. A complex needs at least five recorded sales to appear.
| Complex | Units | Sales | Years | Average | Range |
|---|---|---|---|---|---|
| Snowcreek | — | 71 | 2011–2025 | $821k | $50k–$3.7M |
| The Westin Monache | — | 33 | 2011–2025 | $636k | $140k–$1.8M |
| The Village | — | 33 | 2011–2025 | $823k | $25k–$2.4M |
| Westin Monache | 238 | 26 | 2011–2025 | $403k | $64k–$1.1M |
| Sunstone | 78 | 19 | 2012–2023 | $533k | $43k–$1.6M |
| Juniper Springs Lodge | 178 | 19 | 2011–2024 | $474k | $212k–$880k |
| Grand Sierra Lodge | — | 19 | 2011–2025 | $583k | $100k–$1.4M |
| White Mountain Lodge | 90 | 18 | 2011–2025 | $680k | $240k–$1.4M |
| The Bluffs | — | 15 | 2012–2025 | $1.3M | $260k–$6.0M |
| Aspen Creek | 79 | 14 | 2013–2023 | $418k | $100k–$701k |
| The Summit | 211 | 13 | 2011–2025 | $371k | $145k–$720k |
| Eagle Run | 37 | 13 | 2011–2025 | $598k | $30k–$1.2M |
| The Lodges | — | 12 | 2012–2022 | $1.0M | $200k–$1.6M |
| Creekhouse | — | 12 | 2012–2024 | $1.2M | $495k–$2.1M |
| Solstice | — | 11 | 2012–2025 | $548k | $230k–$900k |
| Lincoln House | 78 | 11 | 2011–2024 | $673k | $415k–$1.3M |
| Stonegate | 15 | 10 | 2013–2021 | $1.2M | $800k–$2.0M |
| Mountain Shadows | 131 | 10 | 2011–2025 | $424k | $133k–$600k |
| Courchevel | 61 | 10 | 2014–2023 | $548k | $170k–$925k |
| Mammoth Green | — | 9 | 2011–2022 | $540k | $240k–$910k |
| Horizons Four | — | 9 | 2017–2025 | $565k | $225k–$1.4M |
| Bigwood | 109 | 9 | 2018–2025 | $734k | $20k–$2.4M |
| Sierra Park Villas | 103 | 8 | 2013–2024 | $515k | $128k–$735k |
| Mammoth Ski & Racquet | — | 8 | 2012–2024 | $507k | $195k–$705k |
| Sierra Manors | 150 | 7 | 2011–2023 | $367k | $86k–$750k |
| Seasons Four | 51 | 7 | 2012–2023 | $550k | $129k–$879k |
| Mammoth Estates | 82 | 7 | 2014–2025 | $1.0M | $429k–$2.4M |
| The Trails | — | 6 | 2012–2023 | $690k | $205k–$1.4M |
| Sierra Valley Sites | — | 6 | 2014–2023 | $720k | $65k–$1.0M |
| Mountainback | 122 | 6 | 2014–2025 | $692k | $265k–$1.4M |
| Mammoth Slopes | — | 6 | 2015–2022 | $894k | $255k–$1.5M |
| Juniper Ridge | — | 6 | 2012–2024 | $1.8M | $225k–$5.0M |
| Hidden Valley | — | 6 | 2017–2021 | $483k | $100k–$1.1M |
| Gray Bear | — | 6 | 2015–2017 | $1.3M | $828k–$1.6M |
| Discovery Four | — | 6 | 2011–2014 | $185k | $130k–$300k |
| Canyon Lodge | — | 6 | 2013–2022 | $964k | $255k–$1.8M |
| Viewpoint | — | 5 | 2011–2022 | $292k | $175k–$600k |
| The Westin | — | 5 | 2014–2025 | $878k | $195k–$2.4M |
| The Pointe | 14 | 5 | 2020–2022 | $921k | $500k–$1.3M |
| The Bridges | 48 | 5 | 2013–2019 | $395k | $100k–$549k |
| Obsidian Villas | — | 5 | 2020–2022 | $2.0M | $1.3M–$2.6M |
| Meadowridge | — | 5 | 2013–2018 | $456k | $240k–$645k |
| La Vista Blanc | — | 5 | 2015–2021 | $376k | $298k–$449k |

Or read it a year at a time
Everything on this page is organised by series, which is how the data is shaped and not how anyone remembers a town. There is a page for each of the 48 years the record covers — what a condominium cost, how much snow fell, what opened and closed, and what the paper was writing about that year.
The scans and the photographs
6 newspaper pages from 1971 to 1990, scanned whole and readable, and the photographs behind the bands on this page — each one dated and credited. Open the archive →
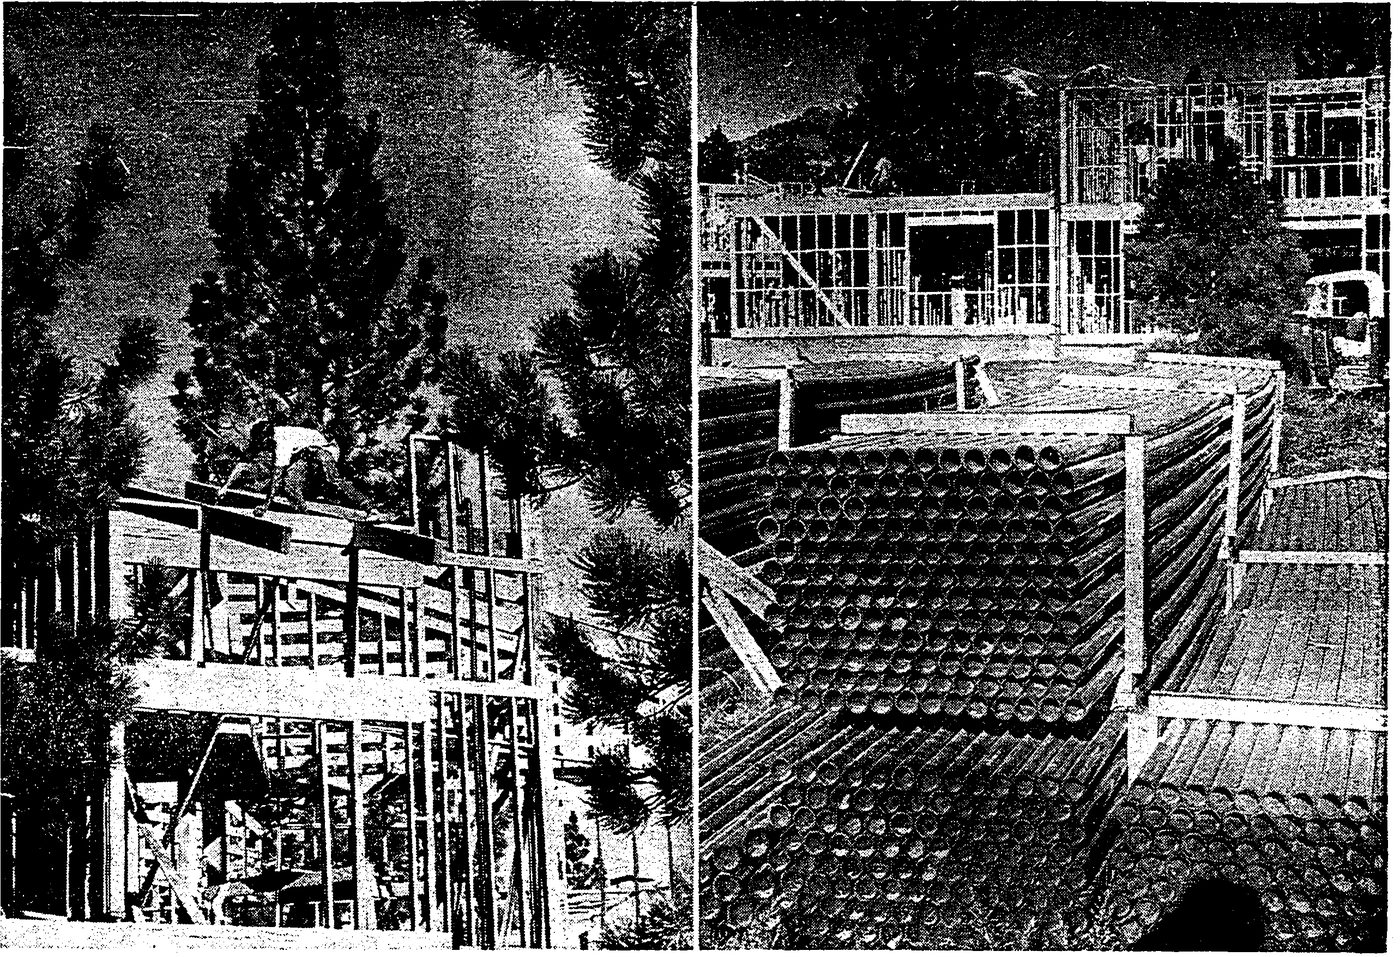 1971Sierra Park Villas under constructionLos Angeles Times
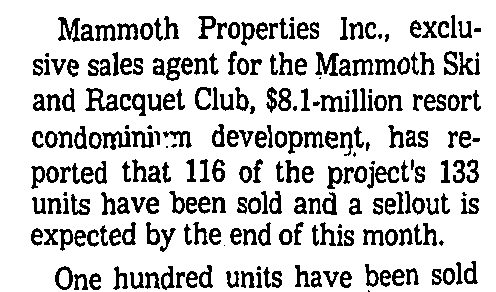 1972Condominiums near sellout at MammothLos Angeles Times
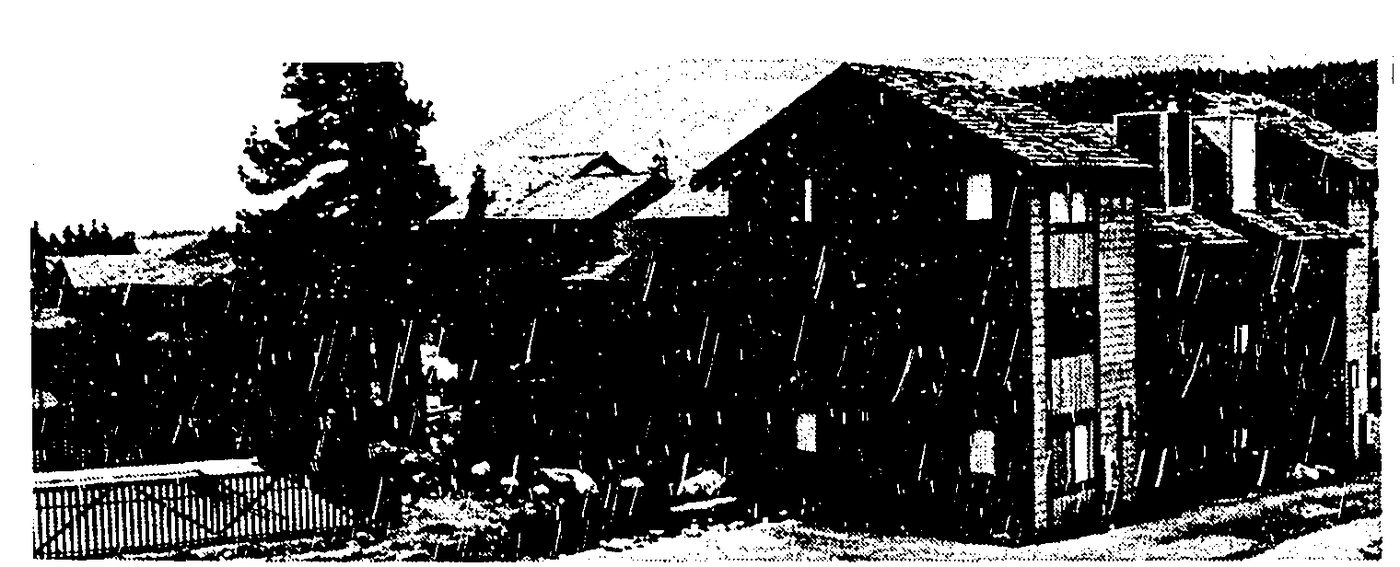 1972Lottery slated for Mammoth condominiumsLos Angeles Times
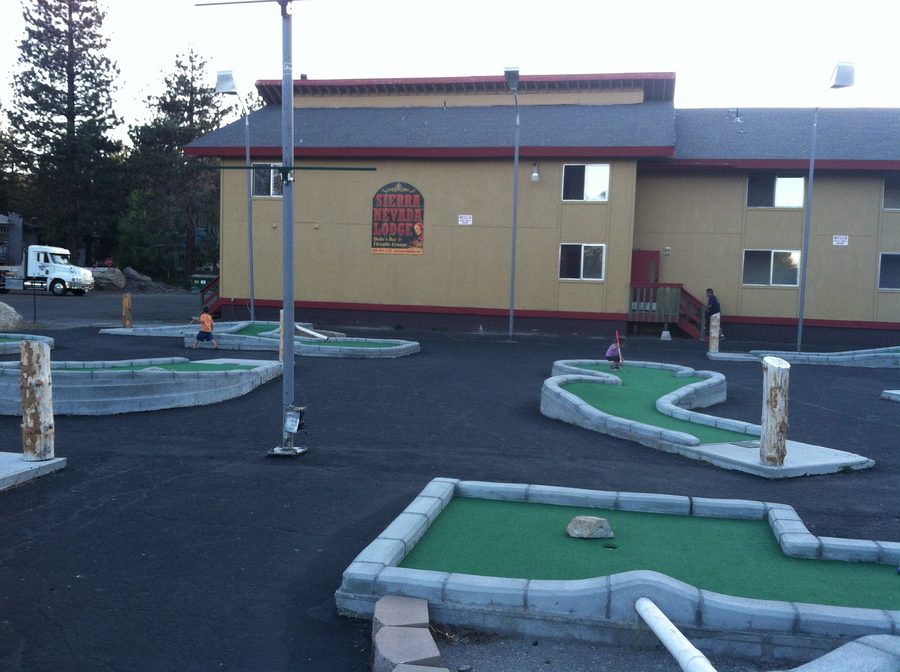 2012-07-21The same lot in 2012: Frosty's mini golf, beside the Sierra Nevada LodgeThe Latest
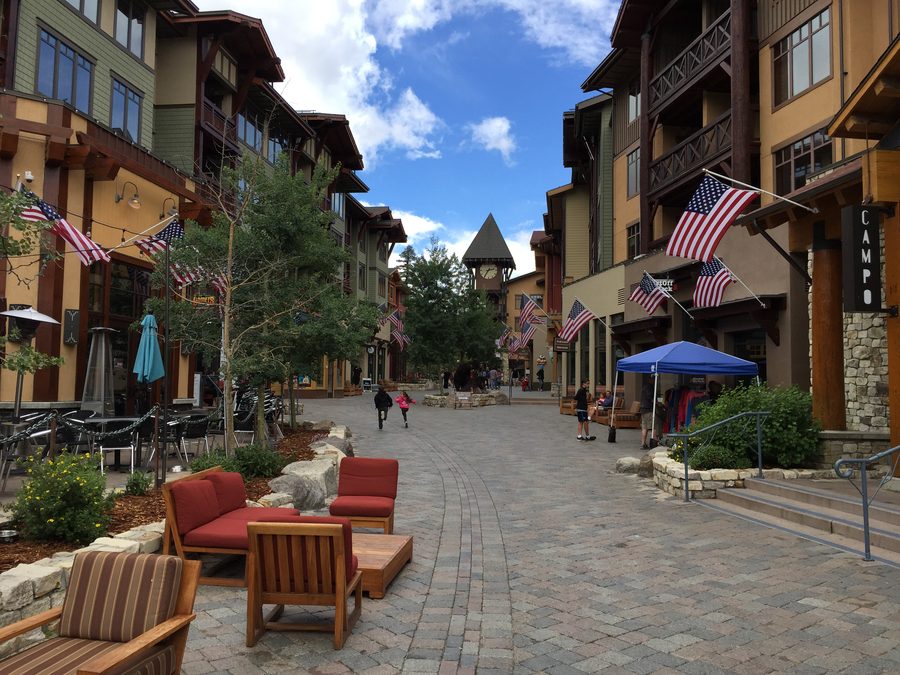 2015-07-09The Village at Mammoth, opened 2002The Latest
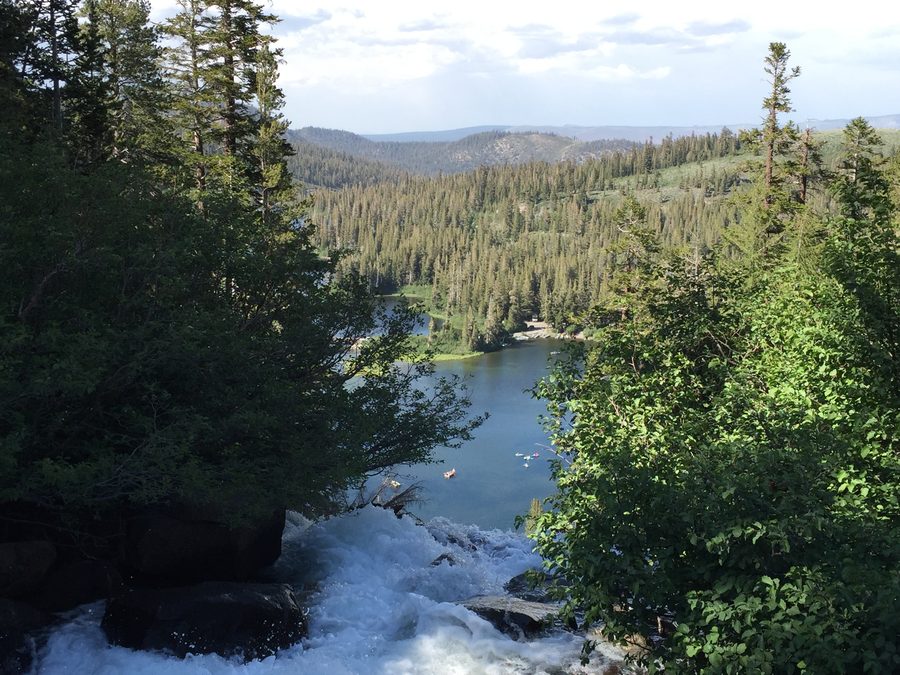 2016-07-01Twin Lakes, from the falls in the upper Lakes BasinThe Latest
What the Town Council and its committees are deciding
The Town's old Agenda Center is dead — its category list is empty and its RSS feed returns nothing. It moved, sometime before this was written, to a hosted eSCRIBE portal this site found by reading the Town's own homepage rather than by any published notice. Every meeting packet bundles the agenda with the prior meeting's minutes, staff reports and contracts, so what follows is pulled from the packets themselves, not just the printed outline.
Consideration of Design Review (DR) 26-002 for a major modification to the approved “Rockspring” resort condominium development project located in the “Resort General” zone of the North Village Specific Plan (NVSP). The proposed modification would add a a third level to the amenity building, providing an additional 5,855 square feet of amenity space. The proposed change remains consistent with the CEQA conformance analysis prepared for the Rockspring project, which determined that the project is in conformance with the certified 1999 North Village Specific Plan Subsequent Program Environmental Impact Report (SPEIR). packet ↗
Adopt the resolution authorizing the temporary closure of certain Town roads for special events. packet ↗
Update and Request Approval to Continue Airport Emergency Contract Work. packet ↗
Approve and authorize the Town Manager to sign the contract with Cisco for a new phone system. packet ↗
Ordinance to Renew Town’s Military Use Policy. packet ↗
Hold a public hearing to discuss expenditures and accomplishments of the Town’s 2022 Community Development Block Grant (22-CDBG-HA-10034). packet ↗
Consider the ordinance amending Section 2.04.040 of the Town of Mammoth Lakes Municipal Code related to Town Council Salaries. packet ↗
Consider authorization of the Professional Services Agreement with Kosmont Companies for the provision of financial advisory services related to the Mammoth Crossing project and the potential revenue sharing component of the project. packet ↗
Pursuant to Government Code Section 54956.8, the Town Council will hold a conference with its representatives in regard to property negotiations pertaining to: Property: 550 Mono Street, Unit C201 / APN 033-165-008-000 Agency Negotiators: Marcus Sproll, Nolan Bobroff, Rob Patterson Negotiating Parties: Town of Mammoth Lakes and Eastern Sierra Community Housing Under Negotiation: Price and terms of payment. packet ↗
Budget Update and Final Approval - Final draft of MLT’s Measure A and Tourism Business Improvement District (TBID) budgets for Fiscal Year 2026-2027 with Board discussion and vote to approve packet ↗
Financial Reports Receive an update regarding the financial health of the Mammoth Lakes Tourism and the results of the previous month for Transient Occupancy Tax (TOT), the Tourism Business Improvement District (TBID) and current account balances. packet ↗
Adopt the resolution establishing the middle-income housing policy statements. packet ↗
Update and Approval to Continue Airport Office Emergency Contract Work. packet ↗
Ordinance to Renew Town’s Military Use Policy. packet ↗
Consideration of Zoning Code Amendment 26-001 to amend Municipal Code Section 17.52.055 – Accessory Dwelling Units (ADUs). The proposed Zoning Code Amendment has been found to be exempt from CEQA. packet ↗
Consideration of the 5-year Capital Improvement Plan (CIP) for years 2026 - 2031 and adopt a resolution finding the CIP to be in conformance with the General Plan. packet ↗
General Plan conformance determination for the Mammoth Lakes Fire Protection District acquisition of the property located at 40 Mountain Boulevard that is developed with an 8-unit multifamily residential structure for the purpose of providing workforce housing for the Fire District. packet ↗
Update and Approval to Continue Airport Emergency Contract Work. packet ↗
Re-appoint Michael Vanderhurst and Billy Deaver to the Planning and Economic Development Commission and Silver Chesak and Dan O’Connell to the Parks and Recreation Commission with terms expiring on July 31, 2030. packet ↗
Adopt the Resolution ordering the levy and collection of assessment within the Community Facilities District No. 2013-3 (Transit Services) for fiscal year 2026/27. packet ↗
Adopt the Resolution ordering the levy and collection of assessment within the Community Facilities District No. 2004-1 (Fractional) Mello Roos District. packet ↗
Adopt the Resolution ordering the levy and collection of assessment within the Community Facilities District No. 2005-1 (In Lieu DIF) for Fiscal Year 2026/27. packet ↗
Adopt the Resolution ordering the levy and collection of assessment within the Community Facilities District No. 2023-1 (Maintenance Services) for Fiscal year 2026/27. packet ↗
Authorize the Town Manager to execute an agreement with DIRTT Environmental Solutions, Inc. to purchase and install partition walls for the skate rental area at the CRC. packet ↗
Ordinance to Renew Town’s Military Use Policy. packet ↗
Middle-Income Housing Policy Statements and Predevelopment Steps for a Middle- Income Rental Housing Project at the Parcel. packet ↗
Approve Resolution setting At-Will, Non-Represented Employees compensation, benefits, and other terms and conditions of employment for fiscal years 2026-27, 2027-28, and 2028-29. packet ↗
Approval of Third Amended Employment Agreement with Town Manager, Robert Patterson. packet ↗
Financial Reports Receive an update regarding the financial health of the Mammoth Lakes Tourism and the results of the previous month for Transient Occupancy Tax (TOT), the Tourism Business Improvement District (TBID) and current account balances. packet ↗
Middle-Income Rental Housing – Conceptual Model Project. packet ↗
Update and Approval to Continue Airport Emergency Contract Work. packet ↗
Approve and adopt Resolution No. 26-XX establishing the fiscal year 2026-27, 2027- 28, and 2028-29 compensation schedules for the Mammoth Lakes General Employees’ Association (“GEA”), the Mammoth Lakes Management Employees’ Association (“MEA”), and the Mammoth Lakes Public Works Employees’ Association. packet ↗
Approval of Appropriations Limit, Investment Policy, Reserve Policy, Debt Policy, and Annual Budget for Fiscal Year 2026-27. packet ↗
Services Agreement with Mammoth Lakes Recreation (FY26-27 – FY28-29). packet ↗
Services Agreement with Eastern Sierra Community Housing (FY2026-27). packet ↗
Services Agreement with Mammoth Lakes Tourism (FY26-27 – FY30-31). packet ↗
Consideration of Tentative Tract Map (TTM) 25 002, Use Permit (UPA) 25 001, and Major Design Review (DR) 25 004 for the “Woodsite” project, a resort residential development consisting of 67 units proposed to be subdivided as a Planned Unit Development on an approximately 7.7-acre site within the Specialty Lodging zone of the North Village Specific Plan. Pursuant to the California Environmental Quality Act (CEQA), an Addendum to the 1999 Subsequent Program Environmental Impact Report (SPEIR) has been prepared for the Woodsite project. packet ↗
Population and Housing .....................................................................................13 packet ↗
POPULATION AND HOUSING packet ↗
Waive the reading and adopt by title only the ordinance adopting Municipal Code 8.40 regarding aquatic invasive species. packet ↗
Update on Contract Negotiation with Mammoth Lakes Recreation (MLR). packet ↗
Resolution finding emergency circumstances justify the award of emergency contracts at Mammoth Yosemite Airport (MMH). packet ↗
Fiscal Year 2026-27 – Tentative Budget (Manager Recommended). packet ↗
2026-27 Parks and Recreation Department Recommended Budget Presentation packet ↗
Update on Town Contract Negotiations packet ↗
Financial Reports Receive an update regarding the financial health of the Mammoth Lakes Tourism and the results of the previous month for Transient Occupancy Tax (TOT), the Tourism Business Improvement District (TBID) and current account balances packet ↗
Receive a presentation on Financing Middle-Income Rental Housing. packet ↗
Authorize the Town Manager to sign the Mammoth Unified School District (MUSD) and Town of Mammoth Lakes (TOML) Letter of Intent and Offer to Negotiate Exchange of Properties and the Access Agreement. packet ↗
Adopt the resolution authorizing the temporary closure of certain Town roads for special events. packet ↗
Waive the reading and introduce by title only the ordinance adopting Municipal Code 8.40 regarding aquatic invasive species. packet ↗
Fiscal Year 26-27 Preliminary (Department Requested) Budget Presentation. packet ↗
CONFERENCE WITH LEGAL COUNSEL--EXISTING LITIGATION (Paragraph 1 of subdivision (d) of Section 54956.9) Name of case: Successors to Jesus Uribe Corona v. Mammoth Lakes Police Department (Case No: 25UCM62) packet ↗
Receive a presentation on Defining Middle-Income Housing. packet ↗
Dave and Roma McCoy Arts and Cultural Center Construction Update and Operating Plan Presentation. packet ↗
Adopt the resolution approving the FY2026-27 project list to be submitted to the California Transportation Commission (CTC) for funding from the Road Maintenance and Rehabilitation Account (RMRA) funds under Streets and Highways Code Section 2034. packet ↗
Approve the resolution adopting the Town of Mammoth Lakes Safety Action Plan. packet ↗
Award contract for the 2026 Slurry Seal Project to Pavement Coatings Co. packet ↗
Award the annual contract for publication of legal notices to The Sheet. packet ↗
Public hearing in accordance with the addition of Government Code Section 3502.3 to the Meyers-Milias-Brown Act, and under Assembly Bill 2561, to present on the status of vacancies, recruitment, and retention efforts prior to the adoption of a final budget. packet ↗
Golden Mussel Ordinance Discussion and Direction. packet ↗
Source: Town of Mammoth Lakes eSCRIBE meeting portal. Flags are a keyword match on the extracted item text (development, agreement, ordinance, housing, budget and similar terms) — a first cut, not a read of what the item actually decides.

What people said was happening, at the time
Earthquakes, recessions, the mountain changing hands, the Village going up, a pandemic. Where somebody wrote down what they thought was going on, their words are here with their name on them — including where two of them flatly contradict each other about the same year.
“This increase is attributed to a number of new condominium sales in “Obsidian” driving the condominium market.”Matthew Lehman Report ↗
“Most local condominium projects have already seen major escalations in the their insurance premiums”Paul Oster Broker Report ↗
“individual drought winters, or a more prolonged period of drought, don’t appear to have any significant or direct impact”Paul Oster Broker Report ↗
“The TOT increasing Measure L passed by a 63% margin.”Paul Oster Broker Report ↗
“The long anticipated September Federal Reserve rate drop has had the opposite effect than what was expected.”Paul Oster Broker Report ↗
“The RMF-2 zoned condo I have listed had more showings in the last few days than in the past two months.”Paul Oster Broker Report ↗
“5 were released and spoken for within 8 minutes of their release”Matthew Lehman Report ↗
“Purchase price reduced $52,000 and commissions reduced to 5% to keep buyer from cancelling”Paul Oster Broker Report ↗
“California has seen an increase in the number of insurance companies unwilling to write new insurance policies in the state”Matthew Lehman Report ↗
“the added costs (special assessments) and hassles as a result of this winter may shake-out additional condo owners”Paul Oster Broker Report ↗
“the banking unease alone could drive buyers into the Mammoth market looking for a place to park money”Paul Oster Broker Report ↗
“one-third of the condo inventory are properties at the Westin Monache. This is a huge imbalance.”Paul Oster Broker Report ↗
“Skyrocketing mortgage rates are clearly impacting the market but Mammoth is also experiencing low inventory.”Paul Oster Broker Report ↗
“Demand for vacation homes was still up 13% from pre-pandemic levels, but it’s declining after a pandemic-fueled second-home boom”Paul Oster Broker Report ↗
“All of the recent new construction and infusion of capital is clearly a byproduct of this Alterra affiliation.”Paul Oster Broker Report ↗
“The hazardous air quality and lack of inventory are all clearly impacting the sales activity.”Paul Oster Broker Report ↗
“the Covid lockdowns froze the market and there was incredible uncertainty as to what would happen”Paul Oster Broker Report ↗
Where every number came from
This is the whole record, assembled from newspaper archives, adopted Town documents, broker reports and public data. Most of it has never been in one place before, and nothing before 1998 exists in any digital housing dataset. Nothing here is modelled or filled in: where sources disagreed the disagreement was resolved by a stated rule, and where the record is thin the page says so rather than smoothing over it.
| Publisher | What it is | Covers |
|---|---|---|
| CA Dept of Insurance / CA FAIR Plan / CAL FIRE | FAIR Plan policies and exposure, non-renewals, fire hazard severity zonesFAIR Plan is California's insurer of last resort; growth in its policy count is the clearest available signal that ordinary insurers are withdrawing. Fiscal-year reporting. Note that an active non-renewal moratorium suppresses observed non-renewals, so a low count during one does not mean the market has recovered. | — |
| CDEC / NOAA GHCN / Mammoth Mountain | Snow course, snow pillow, climate station and ski-season recordsMixed sources by design. CDEC snow courses are monthly manual measurements from 1928; CDEC pillows are automated daily; NOAA GHCN are daily climate observations. Resort snowfall is measured at Main Lodge ~8,900 ft — the resort's own table averages ~352 in/season, not the ~400 in they market, and Summit totals run 25-30% higher. Never mix elevations. | 1924-11–2026-08 |
| CFPB / FFIEC | Home Mortgage Disclosure Act loan register, Mono CountyEvery reportable mortgage application and origination. Comparing originations against total sales gives an estimate of the CASH share, which is large in second-home markets. | — |
| Federal Housing Finance Agency | House Price Index — annual, developer files (zip5 / zip3 / county / tract / CBSA)Weighted repeat-sales index built from Fannie Mae/Freddie Mac conforming mortgage transactions and appraisals. It is an INDEX (base 100 at series start), not dollars. Two caveats that matter in Mammoth: it excludes cash purchases and jumbo loans — a large share of a second-home resort market — and it includes appraisals, which damp volatility. Expect it to understate both booms and busts here. | 1975–2026 |
| FHFA via FRED (St. Louis Fed) | All-Transactions House Price Index & macro contextRepeat-sales index from Fannie/Freddie conforming mortgages. Index (1995 or 1980=100), NOT dollars. Excludes cash sales and jumbo loans — meaningful caveat in a second-home market like Mammoth. | — |
| Freddie Mac | House Price Index (FMHPI)Monthly repeat-sales index. Published for states and metros — there is no Mammoth or Mono series, so this is California-level context, useful for separating local moves from statewide ones. | 1975-01 |
| IRS Statistics of Income | County-to-county migrationCounts of tax returns, exemptions (a proxy for people) and aggregate AGI moving between counties, by tax-year pair. Captures filers only, lags by roughly two years, and — critically here — records where someone's TAX HOME moved. A Los Angeles owner buying a Mammoth second home never appears in it. | — |
| Town of Mammoth Lakes / Mono County | Housing Elements, Needs Assessments and Community IndicatorsTables in adopted public documents. Generally the most reliable figures we hold for their years — published, dated and methodologically stated — but they appear only every few years. | 1980–2024 |
| United States Geological Survey | FDSN event catalogue, Long Valley Caldera, 1970-presentEvery recorded event of magnitude 2.5 or greater inside a box drawn tightly around the caldera and the town. M2.5 is the floor because below it the catalogue measures how many seismometers were switched on rather than how much the ground moved — the network densified through the 1980s and again in the 2000s. | — |
| US Census BPS / CA HCD / Town of Mammoth Lakes | Building permits, housing production, STR permissionsCensus Building Permits Survey counts housing UNITS AUTHORISED by building permit, broken out by structure size (1-unit, 2-unit, 3-4 unit, 5+ unit) — the 5+ category is the closest available proxy for condo construction. Authorised is not built: permits can lapse, and the gap widens in downturns. THREE FIGURES EXIST FOR EACH YEAR AND THEY MEASURE DIFFERENT THINGS. For 2019: Census annual says 40 units authorised; HCD's APR, self-reported by the Town, says 41 permitted (metric `rhna_permitted`); and the Town later restated RHNA CREDIT to 23 (metric `rhna_produced`). The first two agree within one unit and are genuine permit counts; the 23 is a policy accounting figure, not a measurement, and the restatement corrected RHNA bookkeeping rather than revising how much was built. Use `units_authorized` (Census annual) for supply. Separately, the Census MONTHLY place series does not reconcile with the annual one for a place this small and must never be summed to a year. | 1980–2026 |
| California Association of REALTORS® | Monthly county median sale price, DOM, unsold inventory indexMedian price of EXISTING SINGLE-FAMILY DETACHED homes only, county-wide. Two limits that matter here: it excludes condos entirely — and Mammoth is a majority-condo market — and it covers all of Mono County, not just Mammoth. Use it for long-run shape and as an independent check on the local archives, not as a Mammoth condo series. | 2005-01–2026-06 |
| Mammoth Lakes Board of REALTORS® (RPR®) | RPR market statistics reports, ZIP 93546Realtors Property Resource reports generated off the MLBOR MLS, scoped to ZIP 93546 and split by property type. Charts carry both a current and a 'prior year' series — the prior-year points are restatements, not new observations, and are labelled by the period they describe. | 2001–2022 |
| Mammoth Times | Weekly legal notices and classified advertisements, 1997-2003County Clerk filings printed verbatim each week: fictitious business name statements, statements of abandonment, and ABC licence applications. A filing is not proof of trading — names are registered for businesses that never open and abandoned long after the doors shut — so each is recorded as a filing on a date. | — |
| Realtor.com Economic Research | Inventory Core Metrics (zip & county history)Derived from active LISTINGS on realtor.com, not closed sales. No condo/SFR split at zip level. | — |
| Redfin Data Center | Market Tracker (city/county/neighborhood)Derived from MLS closed sales where Redfin has coverage. NOTE: zip-level file has NO 93546 coverage. | — |
| The Sheet | Weekly market columnsMarket figures printed in The Sheet, most attributed to Matthew Lehman Appraisal Services or to Amber Woodruff. Attribution is preserved per row so the underlying analyst stays creditable. | 2009–2026 |
| Town of Mammoth Lakes | Community Indicators ReportOfficial Town report. Annual median SOLD prices, but only the figures quoted in narrative paragraphs are recoverable — the 2004-2024 chart is vector line art with no data labels, table, or embedded data, so those years were deliberately left blank rather than digitised into estimates. | 2014–2024 |
| Town of Mammoth Lakes / Mammoth Lakes Tourism / FAA | TOT & TBID revenue, visitation estimates, airport enplanementsTOT/TBID figures come from the Town Finance department's own revenue-history workbook. Baseline TOT excludes later voter-approved add-ons (Measure L etc.) — check the note on each row before comparing across eras, or a rate change will read as a demand change. Datafy visitation is modelled from mobile-location data, not counted, and is not comparable to the TOT series in levels. | 1987–FY2025-26 |
| Zillow Research | ZHVI / ZORI / inventory public CSVsZHVI = smoothed, seasonally adjusted measure of typical home value (35th-65th percentile tier); not a median of closed sales. | — |
| Destination Real Estate (Mammoth Lakes) | Monthly market update postsMLS-derived (MLBOR), self-published monthly. Reports a rolling multi-year comparison table, so a single post carries several years of history and later posts restate earlier years. Rows are explicitly tagged SOLD vs ACTIVE LISTING in the source tables. | 2013-07–2026-06 |
| Los Angeles Times | Real-estate and news archive, retrieved via ProQuestFigures hand-extracted from article prose and scanned tables, 1971-1997. The Times covered Mammoth as a second-home market for Southern California buyers, so its reporting is broker-sourced: prices are usually ASKING prices at the time of writing and are stored as list-side unless the text states a sale. Every row keeps its evidence quote and article URL. | 1971–1997 |
| Mammoth Lakes brokerages | Published market statistics (Resort Realty, Jodi Melton, others)MLS-derived statistics published by individual brokerages; definitions vary by publisher. | — |
| Matthew Lehman / homesmammoth.com | Monthly Mammoth Lakes market reports (text)MLS-derived (MLBOR), self-published. YTD figures are often compared against prior FULL-year figures — not like-for-like. Pre-2022 reports sometimes quote ACTIVE LISTING prices rather than sold prices; check provenance note. | 2013-12–2026-08 |
| Matthew Lehman / homesmammoth.com | Chart values recovered by pixel measurementBar-top and gridline pixel positions measured with PIL, converted via a per-chart linear fit anchored on years whose exact values are known from printed tables. Leave-one-out calibration error 0.07-0.4% on high-resolution charts. This is the only source for Mammoth single-family medians before 2006. | — |
| Newspaper archives (various) | Historical price mentionsPrice figures recovered from newspaper coverage outside the LA Times run. | 1971–2010 |
| Paul Oster / Mammoth Real Estate Blog | Bi-weekly broker sales reports (narrative)MLS-derived (MLBOR), written as prose, not tables. Reporting windows are nominally two weeks but vary. 'Back-up' was renamed 'Active Under Contract' ~2019 — concatenate those series. sale_price_low/high span ALL property types and can include garages, lots and mobile homes. | 2006-04–2025-10 |
| Town of Mammoth Lakes | Draft 2009 Housing Needs Assessment (Housing Element background report)A one-time 2008 snapshot (Claritas estimates, EDD, and 2000 Census), not a time series — most metrics here carry only one or two data points. Town and county figures use different underlying counts than this project's own DOF/Census-derived population and housing series, so small disagreements between them are the source disagreeing with itself across methodologies, not an extraction error; both are kept rather than reconciled. | 1999–2008 |
| US Census Bureau | American Community Survey 5-year estimates (B25077 value, B25064 rent)Survey estimates of median OWNER-REPORTED home value — what owners believe their home is worth — not observed sale prices. Each 5-year estimate is a rolling window, so consecutive years overlap and are NOT independent. Town-level margins of error for Mammoth run $60k-$257k, wide enough that year-over-year moves are often statistically meaningless. Use for level and long-run shape only, never for short-run change. | 2009–2024 |
| Matthew Lehman / homesmammoth.com | Market report tables & charts (extracted from images)Values transcribed from spreadsheet screenshots and charts by an LLM vision pass. Each row carries a confidence flag; 'low' means read off a chart axis rather than a printed number. | — |
| RE/MAX of Mammoth (Paul Oster) | Broker's Report, recovered from the Internet ArchiveNarrative broker reports, 1998-2008. Pre-2006 content is chiefly MLBOR ACTIVE-LISTING inventory counts by property type, plus median and average ASKING prices — list side, never sold. Some figures are qualitative ('less than 50', 'around 60') and are stored with an upper-bound or approximate flag in provenance. | 1997-04–2008-03 |